Measuring the right thing will help you understand your current performance, see where you can improve, and point you towards the right direction for growth. But to do so, you need to understand what each sales metric or KPI is telling you about your funnel, and how to use this for better insights.
Sales Funnel Metrics
The first place to start your measurement is by looking at your funnel to get a sense of how leads move through the buying journey.
Sales Funnel Conversion Rates
You should track the number of prospects at each stage of the B2B sales funnel:
- Awareness stage (leads). How many contacts have you found from businesses that have discovered you through your range of marketing activities? How does this break down by each source or activity?
- Interest stage (MQLs). How many contacts have the marketing team identified as being more engaged and flagged as a marketing qualified lead (MQL)?
- Consideration/evaluation stage (SQL). How many contacts have responded positively to communications or further marketing activity and have been passed over to the sales team to approach?
- Evaluation/Engagement stage (opportunities). How many contacts have entered the full sales cycle?
- Action/Conversion stage (closed deals). How many contacts have decided to work with you and how many have walked away?
By breaking down the number of contacts at each stage, you’ll get a sense of the average conversion rate for each part of the funnel and from lead to closed deal. This is a good benchmark to understand how you compare to industry averages and see how your performance improves over time.
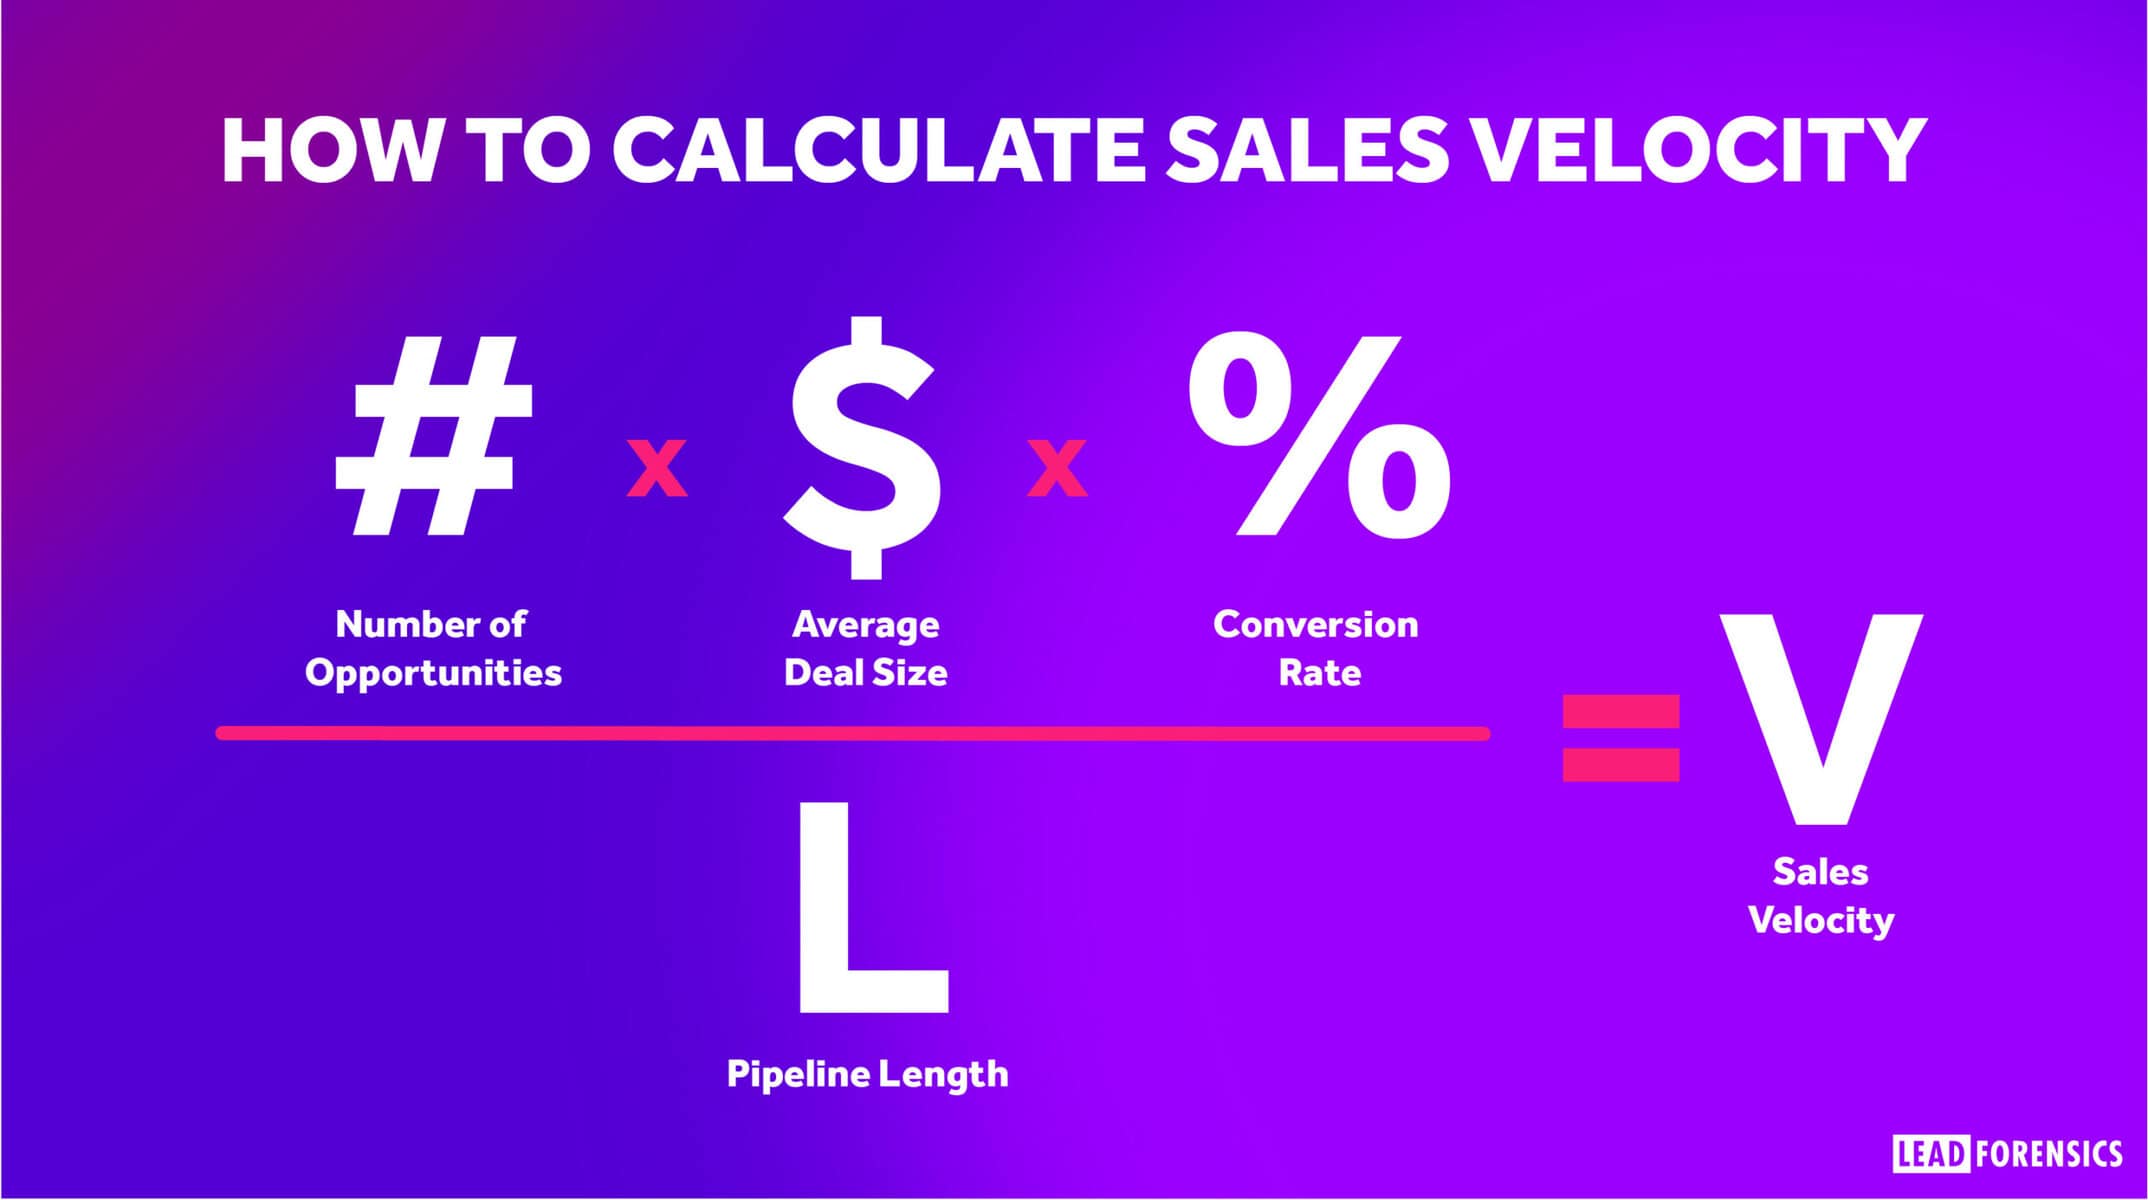
Sales Velocity
Another important metric is your sales velocity, which simply means how quickly it takes you to generate revenue over a specific period.
You can look at this on a daily basis, to get a sense of how much the sales team brings in on specific days, or look at months, quarters, years, and more.
For example, if a sales rep has 10 opportunities to focus on, the average deal size is $10,000, they have a win rate of 20% and the average sales cycle is 45 days, their sales velocity would be $450 per day and $13,500 for the month.
The higher the sales velocity, the more revenue you’re securing. But it’s wise to segment this metric by factors like business size or industry, especially if there are differences in the buying cycle of each segment.
Sales Cycle Length
Similarly, it’s important to measure your sales cycle length. This tells you how long it takes someone to decide to buy something, and in B2B sales this can last 12 months or more.
You can find this metric by looking at your closed sales and working out how much time has passed between the first contact and their purchase date.
Understanding how long your sales cycle is will give you an idea of when leads might convert. But it also gives you an important KPI that you can measure against, because you want to shorten your sales cycle and close deals faster.
Number of Leads Qualified
This metric outlines the success of your first pipeline stage and tells you how many of the new opportunities you found have turned into qualified leads.
When you have a high number of qualified leads, it means your marketing and prospecting are working well and you’re attracting the right types of leads. But if the number is low, it suggests you might be targeting the wrong people.
In practice, this B2B sales pipeline metric is also good for determining which salesperson (or team) has the best understanding of the customer persona. You can then promote their approach as a best practice for your sales team.
If you qualify a large number of leads but fail to achieve a high rate of wins- you need to ask whether your current processes are strict enough to align with essential product criteria or contract terms.
Sales Success Metrics
Being able to monitor how successful you are at selling is another important metric, and there are a few ways to do it.
Win Rate
Your win rate looks at how many deals you closed in comparison to the number of leads you were given. For example, if you had 50 leads to work with and you achieved 20 sales, your win rate is 2 in 5 (or 40%).
Win rate is a helpful sales statistic because it shows which team members perform strongly—and who might need more support.
It’s also a good indicator of whether you’re pursuing the right prospects. If you see consistently low win rates, you might need to target different people or reconsider your approach.
Your win rate can also help you estimate how many deals you could close in a month. For example, if your win rate is 40% and you have 75 leads, you’ll probably close around 30 sales in that period.
Sales Value Metrics
Naturally, sales is about bringing in revenue. That’s why measuring the value of sales is so important.
But it’s more than looking at how much money has been invoiced each month.
Deal Size
The first revenue metric to look at is deal size. If you look closer at the high value deals and the low-value deals, you might spot some factors that influenced the outcome. This insight can help you to start trying something that worked well for a high value deal.
It also lets you find out more about your high value deals. For example, did they take longer to close than the smaller deals? What did the prospect respond well to?
Retention Metrics
It’s hard to win a new client, so making sure you retain them is important. Measuring retention metrics will help you get a sense of how many clients stay with you after their initial period, and how many you lose.
Customer Lifetime Value
Studies show that attracting new customers is more costly than retaining existing ones. If you believe in establishing long-term relationships with your customers, then customer lifetime value (CLV) is one of the B2B sales pipeline metrics you should track.
You can find out your CLV by taking your average order value and multiplying it by the average number of transactions for your customers. For example, if a customer signs up for a year and renews their contract for two more years, you’ll multiply the average order value by 3.
If you can segment the data by things like industry or business size, you might start to see which types of customers generate the highest lifetime value and focus your efforts on closing more of those types of leads.
Customer Retention
A well-executed sales strategy produces highly loyal clients with increased lifetime value. These clients continue to spend money on your products and provide your business with a reliable revenue stream.
It’s very similar to customer churn, but retention rate focuses on the positives by looking at how many customers you have kept.
Customer Churn
Just like retention, churn also looks at retention – but with a focus on attrition, instead.
One way to do this is to take the number of customers you have at the start of the month and how many you have at the end of the month. Another way to do this is to look at how many clients don’t renew after the end of their contract.
When you know your churn, you can benchmark this against your industry and have a solid KPI that you review when you’re lowering your customer churn.
Get More Insights With Lead Forensics
You can turn anonymous B2B website traffic into actionable leads with our visitor identification platform. Get in touch to book your demo now.